Miles Deutscher Finance
2 min read
I Re-Created A Quant Trading Strategy With Claude Code (Nobel Prize Method)
Summary: I Re-Created A Quant Trading Strategy With Claude Code (Nobel Prize Method)
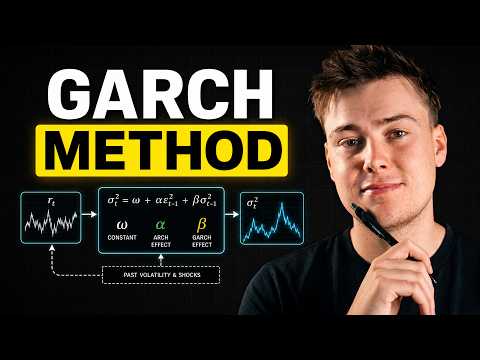
This video presents a quantitative trading strategy based on the GARCH model, rooted in Robert Engle's Nobel Prize-winning work (2003). The focus is on risk management rather than predicting price directions.
Core Concepts
- Quantitative Analysts (Quants) replace opinions with measurable data. They analyze volatility (market 'violence') first, not direction.
- Two key questions per trade: 'Which way?' (direction) and 'How much?' (position size). Quants prioritize the latter as it's controllable.
- Volatility Clustering: Violent days often follow each other – this is more predictable than direction.
The GARCH Model
- Stands for 'Generalized Autoregressive Conditional Heteroscedasticity'.
- Forecasts tomorrow's volatility from three components: baseline level, current shock (15%), and memory (85%).
- No direction prediction – only movement intensity.
Position Sizing Calculation
- Set risk limit: E.g., 15% annual account fluctuation.
- Measure current market violence: E.g., 30% annualized (96% higher than last year → 'storm').
- Adjust position size: Risk limit / violence = 15/30 = 0.5 → half size (e.g., $5,000 instead of $10,000).
Backtest Results (15 years)
- Bitcoin: Volatility-targeted strategy achieved higher returns ($21,000 vs. $17,900) with lower max drawdown (63% vs. 81%) and better Sharpe ratio.
- Nasdaq: Lower losses in crises (e.g., -13% vs. -28% in dot-com crash), but 1% less annual growth – effectively an 'insurance' premium.
Practical Implementation
- Claude Code Skill: Installable via GitHub; allows queries like 'Volatility forecast for Bitcoin' or 'Position size for Nasdaq'.
- TradingView Indicator: 'Storm Gauge' shows market violence, risk limit, and size recommendation.
- Not a silver bullet: Fails during sudden crashes from calm periods or for breakout strategies.
The approach demonstrates how AI makes quantitative methods accessible to retail traders – with a focus on risk management rather than crystal-ball predictions.